
How to Look Up Butler County Jail Population Data
The most current count comes from the public custody portal. The jail-provider table on the Butler/Miami Valley Jails site lists the Butler County Jail population, the contact phone, and how often the data refreshes. At inspection, that table showed a population of 1,131, an update interval of 30 minutes, and a recent last-update timestamp. The number reflects everyone the listed jail provider is holding at that moment, so it moves throughout the day.
The portal posts the live population alongside its search tools.
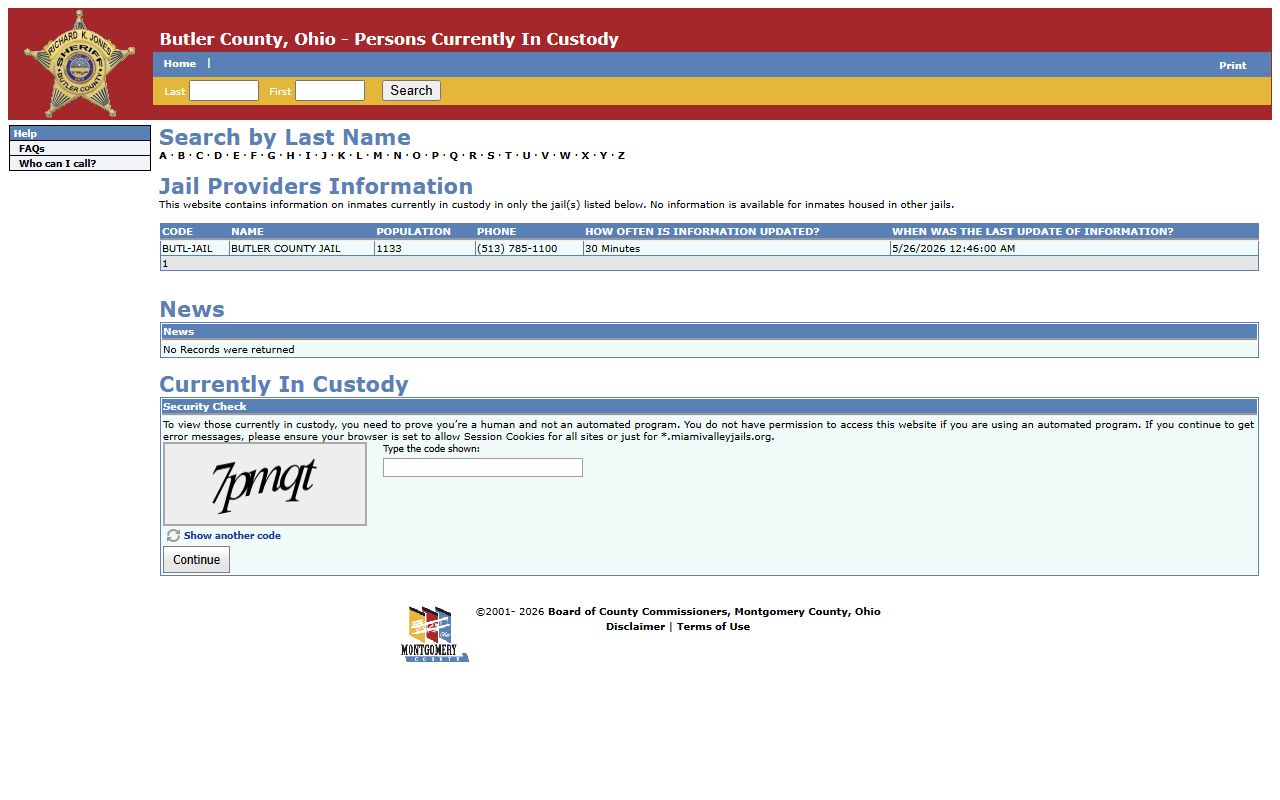
Open the Persons Currently in Custody portal to read the provider table. The page states it covers only the listed Butler County jail, so the count is not a regional or statewide figure.
Butler County Jail Capacity Overview
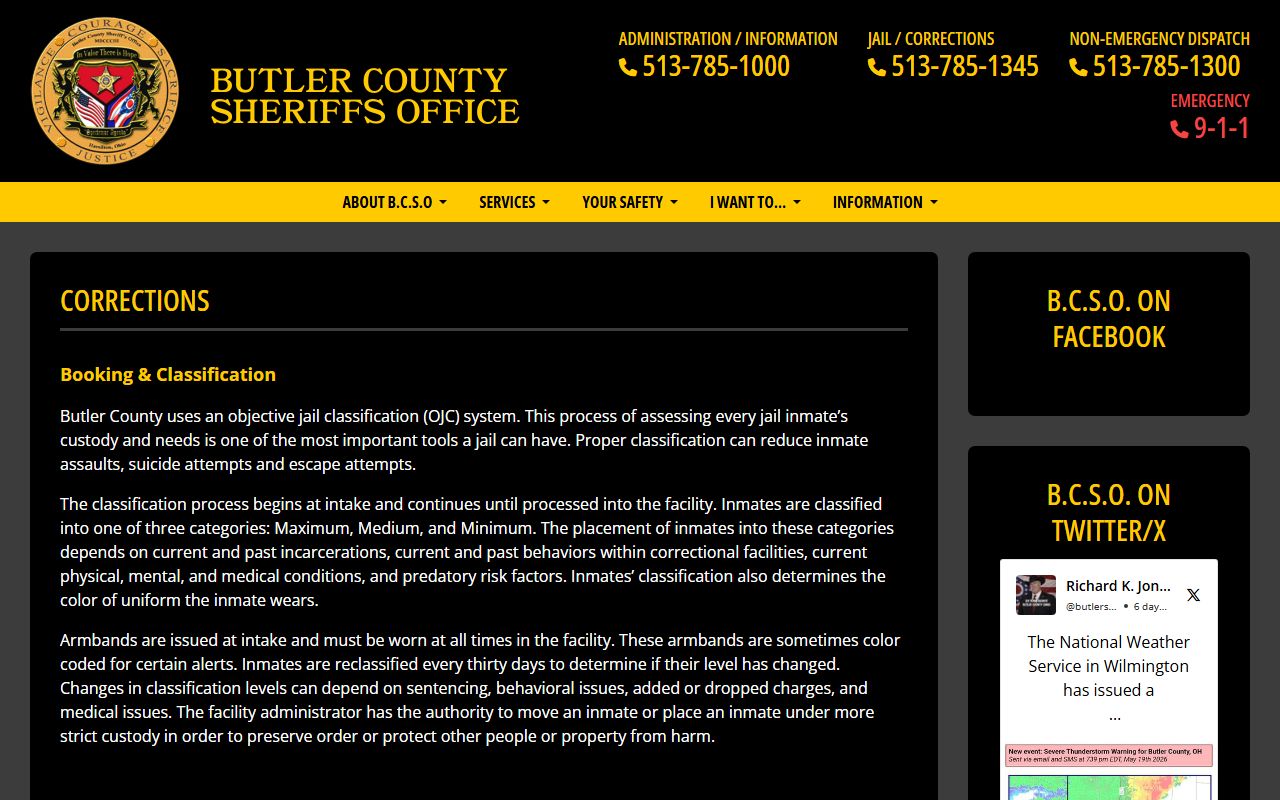
The county runs three jail sites in Hamilton. The Sheriff's Corrections page lists the main Corrections Center capacity as 848 and describes the other two sites as overflow, without publishing their capacity numbers. So the documented formal capacity is 848 for the main jail, while the live portal population was higher across the listed provider. That points to active use of overflow space and contracted detention, but it does not by itself prove overcrowding, since the official capacity for all three sites is not published.
The Corrections page details booking, classification, and the facility roles.
| Facility | Official Capacity | Current Role |
|---|---|---|
| Corrections Center, 705 Hanover Street | 848 | Main jail; bookings and releases; contracted federal holds |
| Resolutions Jail, 442 S. Second Street | Not published | Overflow and administrative offices |
| Court Street Jail, 123 Court Street | Not published | Overflow and property/evidence operation |
| Portal provider total | 1,131 at inspection | Live count across the listed Butler County Jail provider |
Average Daily Population
Average daily population, or ADP, is the mean number of people held per day over a period. It smooths out the hour-to-hour swings the live portal shows. The Butler County Sheriff's accessible pages do not publish an official ADP figure for the jail. For an ADP-style trend, the national and state sources below provide context, but they should not be presented as the county's own count.
If you need an ADP number for a grant, a study, or a report, request it directly from the Sheriff's Office or look for an official county annual report, since a live portal snapshot is not an average. A single high or low reading can come from a weekend booking surge, a court week, or a federal transfer, none of which reflect the typical day.
The practical takeaway is to treat the live portal count as a moment in time. Watching it over several days gives a rough feel for the range, but only an official average should be called the ADP.
Demographic Breakdown
A full demographic breakdown by age, race, and sex is not published on the Sheriff's accessible pages. The same goes for length-of-stay and most-common-charge data. Rather than estimate, this page marks those measures as unavailable from official county sources. National data from the Bureau of Justice Statistics describes jail demographics across the country, which is useful context but not a Butler County figure.
| Measure | County Source Status |
|---|---|
| Age / race / sex breakdown | Not published by the county |
| Average length of stay | Not published by the county |
| Most common charges | Not published by the county |
| Federal / ICE hold percentage | Not published by the county |
Note: treat any demographic figure that is not from an official Butler County source as state or national context, not a county count.
Pretrial vs. Sentenced Population
Jails hold two broad groups. Pretrial detainees are awaiting resolution of a case and have not been convicted. Sentenced inmates are serving a term. Nationally, a large share of jail populations is pretrial, which is why bond and case timing matter so much to the count. The Butler County Sheriff does not publish a pretrial-versus-sentenced split for its jail.
| Group | Meaning | County Figure |
|---|---|---|
| Pretrial | Held while a case is pending | Not published |
| Sentenced | Serving a court-imposed term | Not published |
| Contracted holds | U.S. Marshals, ICE, and BOP detainees | Housed at the Corrections Center |
Because the jail houses contracted federal detainees, the total count includes people who are neither pretrial nor sentenced in a Butler County court.
Federal, ICE, and BOP Contracts
One feature sets Butler County's jail population apart from a typical county jail. The Sheriff's Corrections page states that the Corrections Center houses contracted inmates for the U.S. Marshals Service, Immigration and Customs Enforcement, and the Bureau of Prisons. These contracted holds are part of the live count, even though those people are not Butler County defendants. The county's Transportation Unit also moves federal prisoners to courts in Cincinnati, Dayton, and Columbus, to other prisons and holding facilities, and sometimes to aviation flights.
This matters for reading the data. A population figure that includes federal and ICE detainees is not a measure of local crime or local case volume. When the total runs above the main jail's 848 capacity, contracted holds and overflow space are part of the reason. Anyone comparing Butler County to another county should account for the federal contracts, since not every jail carries the same mix of local and contracted detainees.
The number of contracted detainees on any given day is not published by the county, so it should not be estimated. What is documented is that the contracts exist and that they affect the total count.
Misdemeanor vs. Felony Population
The mix of misdemeanor and felony cases shapes a jail's population. Felony defendants tend to stay longer, while many misdemeanor cases resolve quickly or release on bond. The county does not publish a misdemeanor-versus-felony split for the jail. What is clear from the court structure is that felony cases run through Common Pleas, while misdemeanor and traffic cases run through the Area and Municipal Courts, as the Court of Common Pleas page explains.
For an individual's charge level, the court docket is the source, not the population data. The arrest records page covers the charge-versus-conviction distinction.
Mental Health and Medical Population
Jails carry a significant medical and mental-health load, and Butler County's jail Medical Division runs 24 hours a day, every day, screening inmates and managing care. The county does not publish a count of inmates with mental-health or medical needs. National research shows that a notable share of jail populations has a mental-health or substance-use condition, which is part of why Butler County runs treatment-focused specialty dockets through Common Pleas.
Those programs, including the SAMI court for co-occurring substance abuse and mental illness, aim to move eligible people from custody into supervised treatment, which can affect who stays in the jail over time. Drug Court, Veterans Treatment Court, and Felony Nonsupport Court round out the four certified specialty dockets, each pairing supervision with services rather than a straight jail term. Over months, programs like these can shift a portion of the population out of the jail and into community supervision.
National and State Context
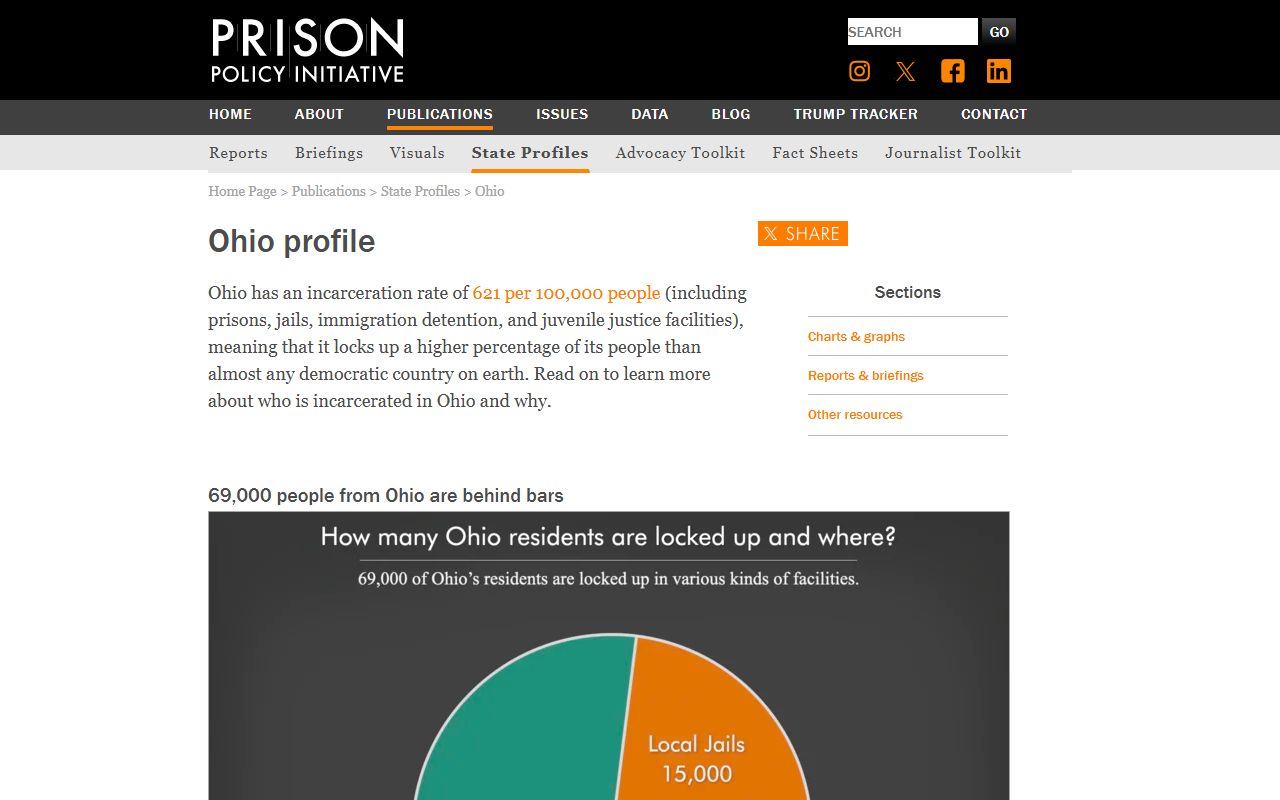
Because the county publishes limited population detail, national and state data provide the backdrop. The Bureau of Justice Statistics is the federal source for jail statistics, including national counts, demographics, and pretrial shares. The Prison Policy Initiative profiles Ohio incarceration in a way that helps place a county number in context.
The Bureau of Justice Statistics publishes the national jail data.
The Prison Policy Initiative Ohio profile frames state-level incarceration.
| Level | Source | Use |
|---|---|---|
| County rate per 100,000 | Not published by official county source | Request from the county or use Vera county data, clearly labeled |
| State context | Prison Policy Initiative | Ohio incarceration profile |
| National context | Bureau of Justice Statistics | National jail counts and demographics |
Population Trends Over Time
An official five-year Butler County jail population trend was not located in the Sheriff's accessible pages. For a historical county-level trend, the Vera Institute's incarceration data tool tracks county jail and prison figures over time and should be cited as Vera, not as the Sheriff's official count. Recent press coverage also touches on the jail's population, in particular its federal and ICE holds.
In January 2026, a news outlet reported that state officials and attorneys were seeking information about ICE detainee conditions at the Butler County Jail.
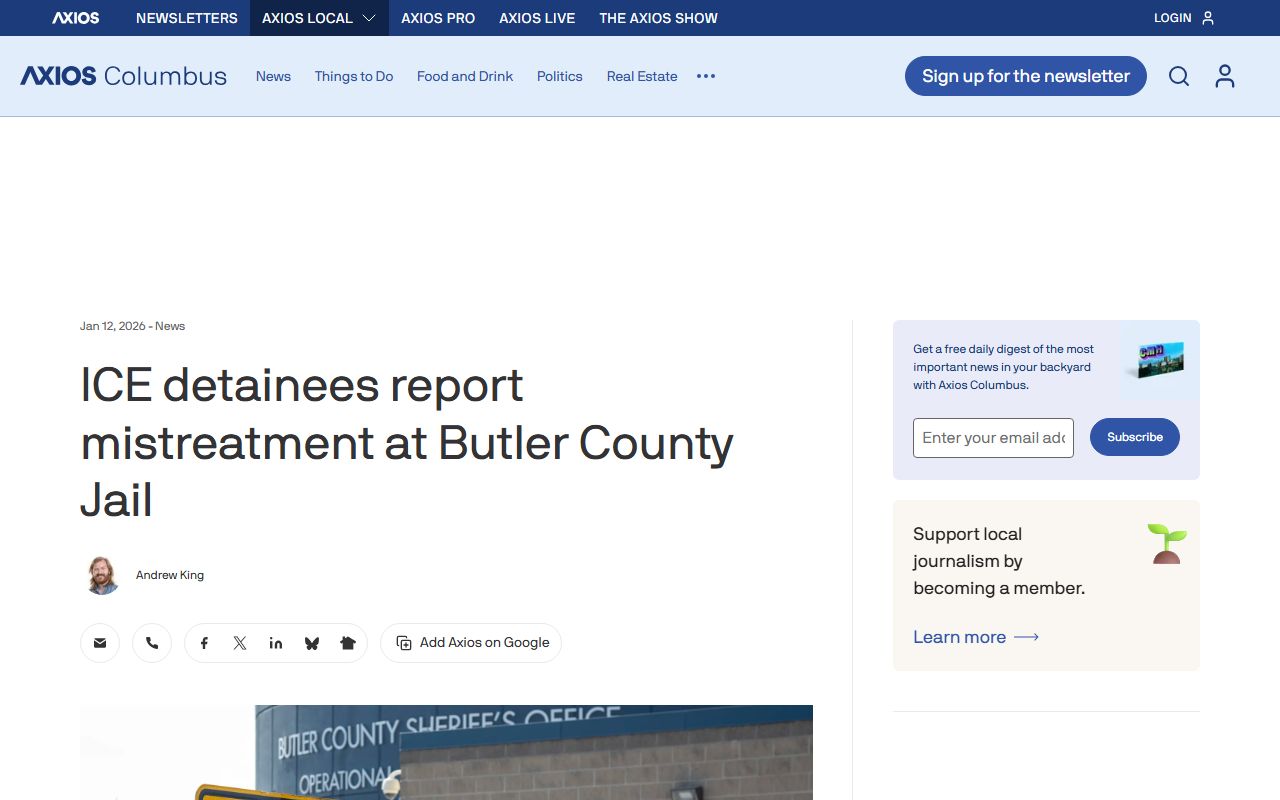
That coverage is a non-official news source and is noted here with attribution. It illustrates that the jail's population includes contracted federal detainees, which shapes how the total count should be read.
Searching for Butler County Inmate Records by Name
This page covers population data, not individual lookups. To find a specific person in custody, use the name search on the inmate records page, and to confirm a release, see the released inmates page.
Where the Data Comes From
Each number on this page has a source, and the source decides how much weight it carries. The live count comes from the Butler/Miami Valley Jails provider table, which the Sheriff feeds and which refreshes every 30 minutes. The 848 capacity comes from the Sheriff's Corrections page. National and state context comes from the Bureau of Justice Statistics, the Prison Policy Initiative, and the Vera Institute.
What the county does not publish, this page leaves blank rather than guessing. That is the honest way to present jail data, since a fabricated demographic split or trend would mislead readers who rely on it. When a county figure and a national figure sit side by side, the label matters as much as the number, so each one here names its origin.